Emission Split
Emissions are allocated across vaults based on APR × TVL. Vaults that generate more yield for the system receive a larger share of emissions, aligning incentives with productivity.Emission Distribution
- Phase 1: emissions are directed to PT single stakers
- Phase 2: emissions shift to PT/STRIP liquidity providers
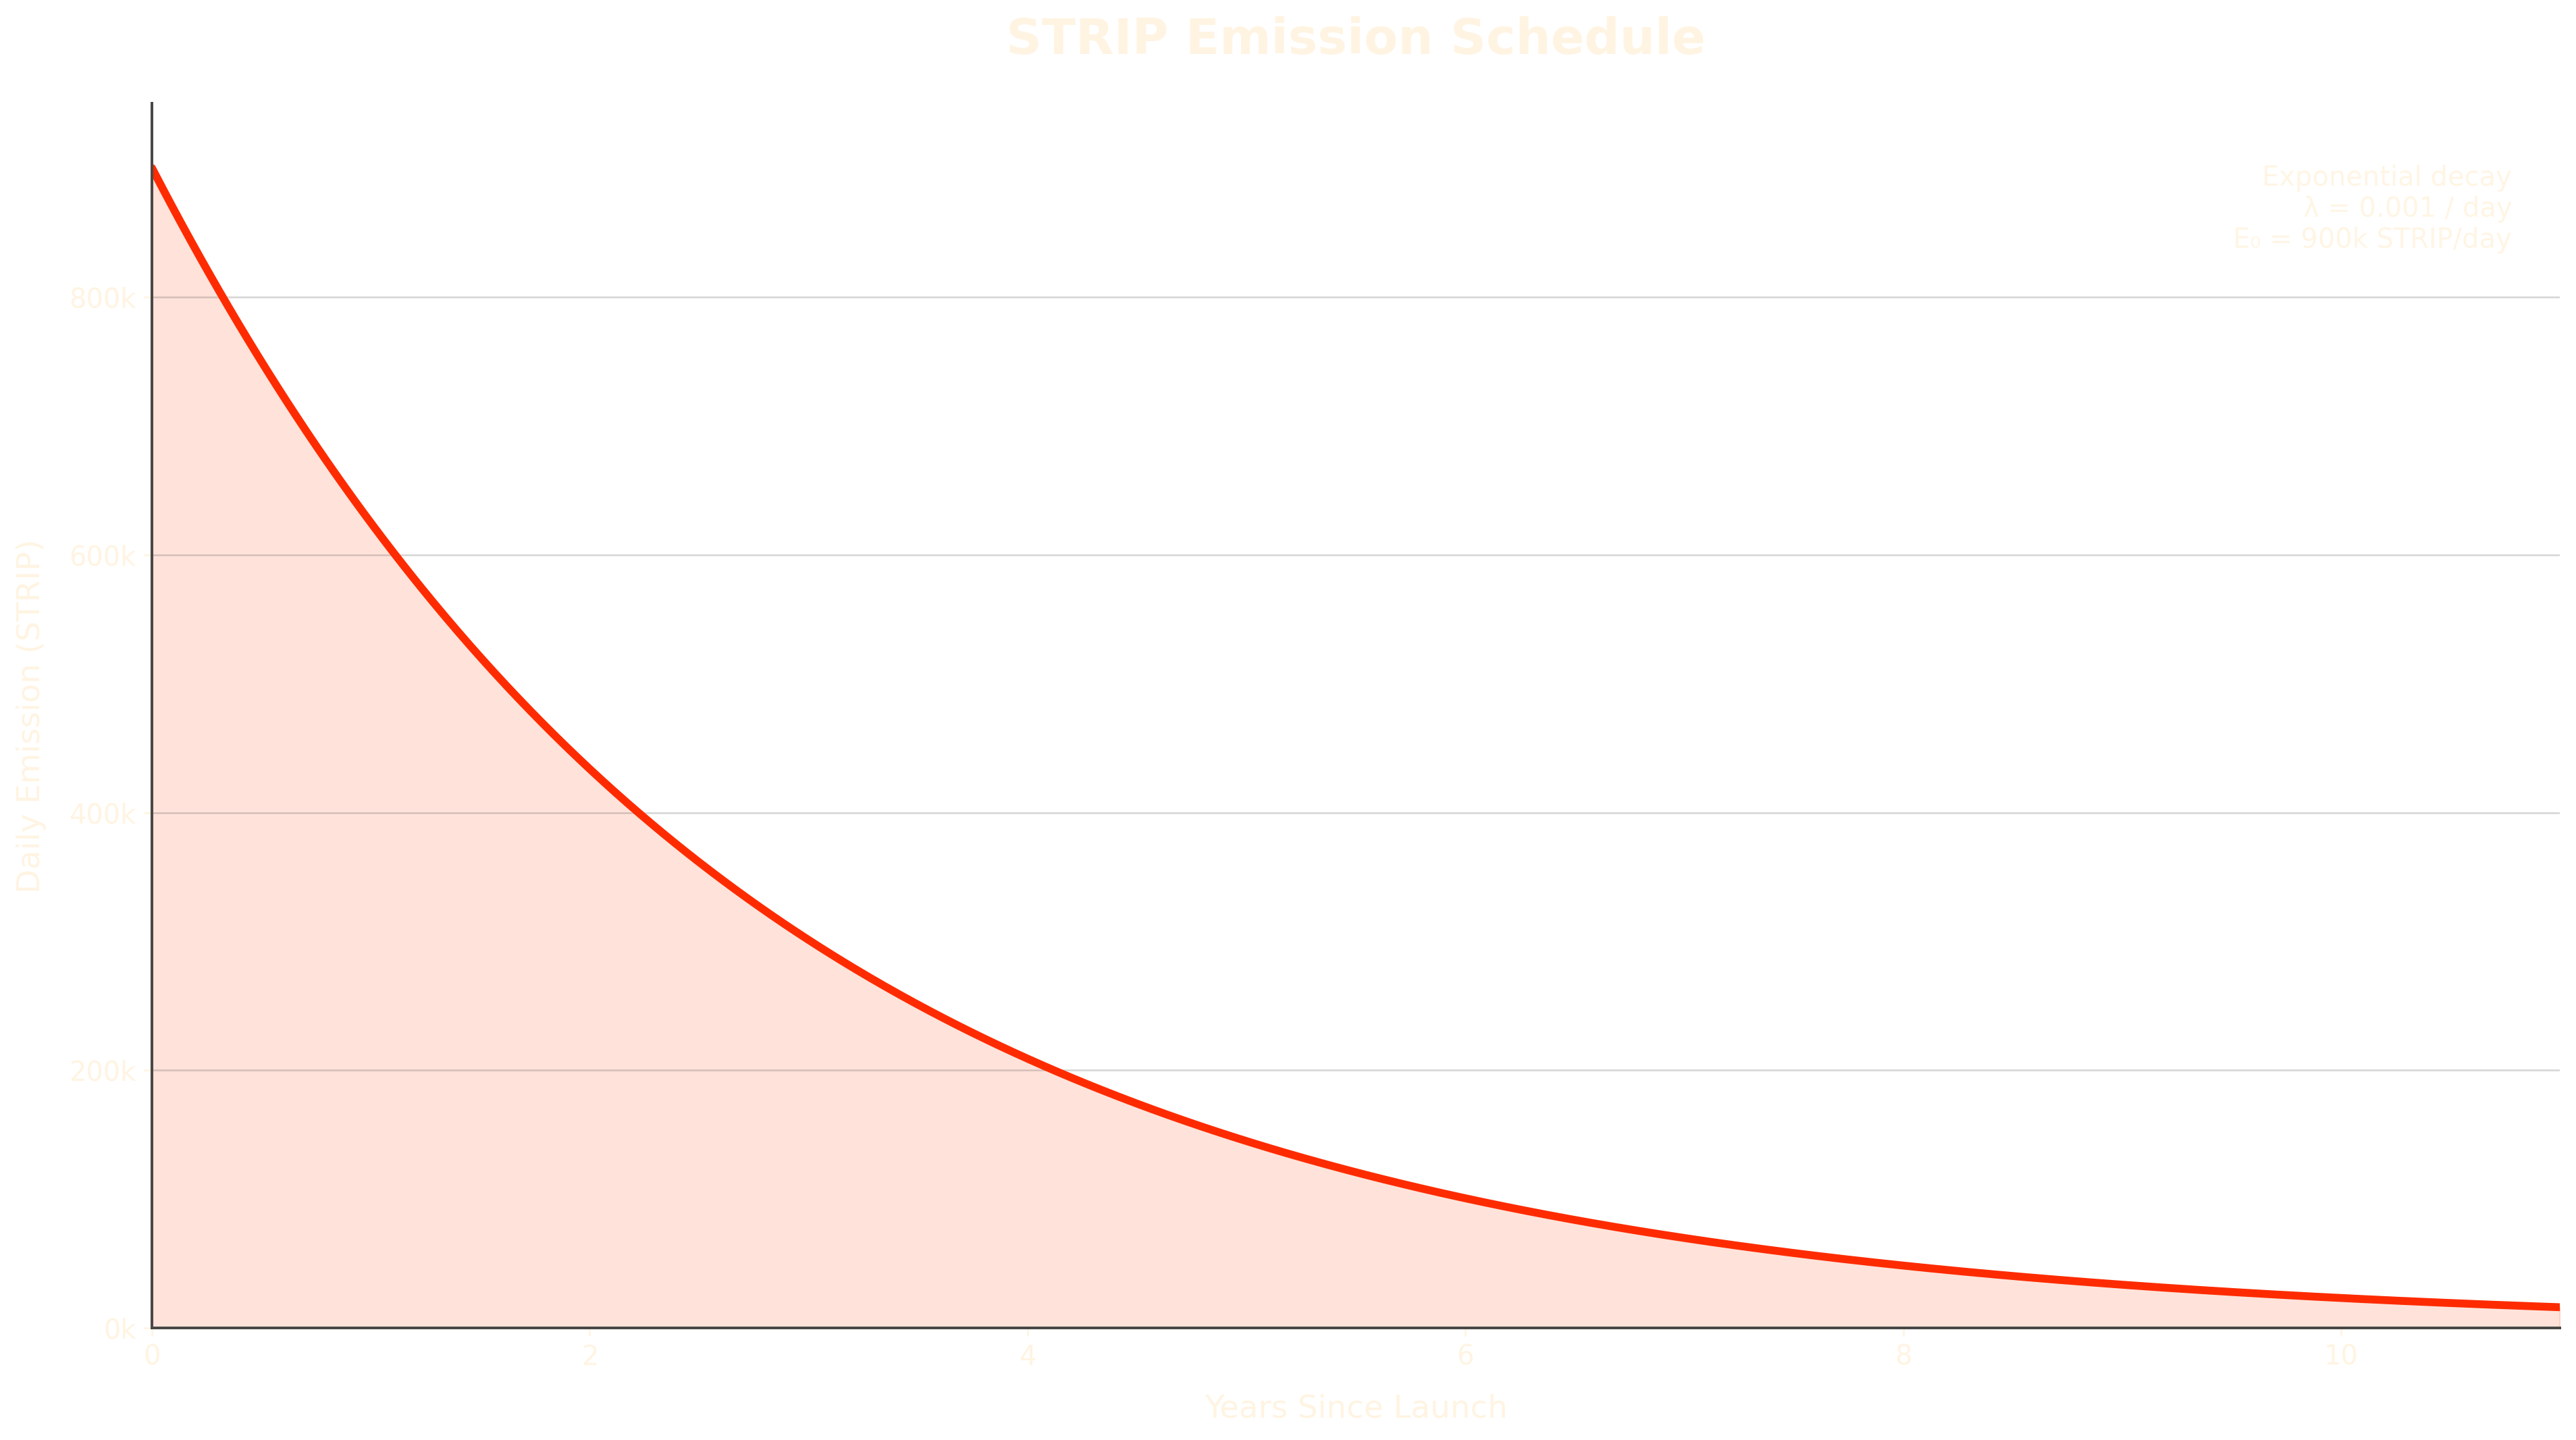
Emission Schedule
STRIP emissions follow a deterministic exponential decay:- E(t) = E₀ × exp(−λ × t)
- Initial rate (E₀): 900,000 STRIP per day
- Decay constant (λ): 0.001 per day